Data & Analytics
Financial Portfolio Analysis (12 Companies)
Python, Power BI
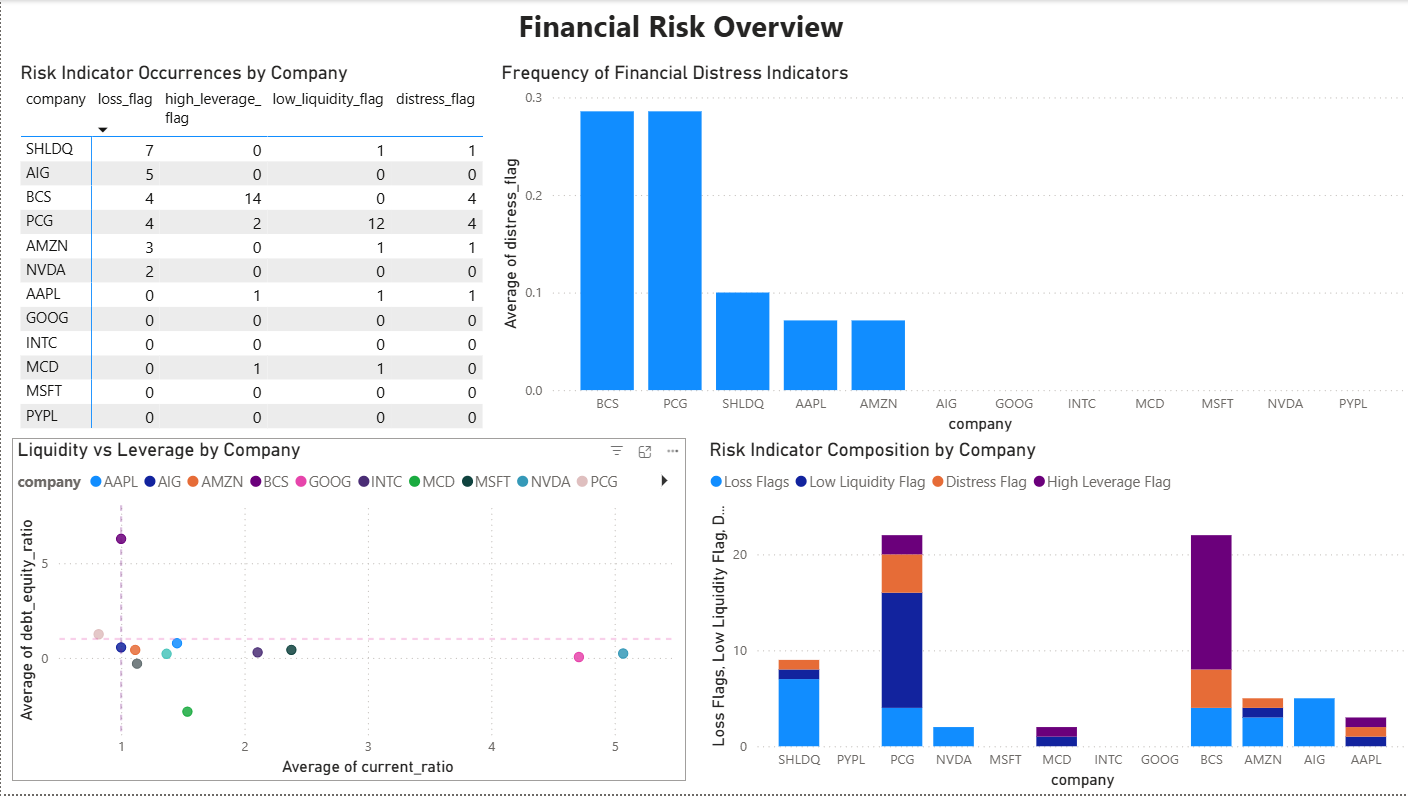
Financial performance analysis for 12 U.S. companies using Python for data cleaning and metric engineering. Dynamic Power BI dashboards for profitability, cash flow, and risk indicators.
Overview
Analyzed financial statements for 12 U.S. companies. Built Python ETL pipeline for data preparation and Power BI dashboards for interactive exploration of profitability, liquidity, and risk.
Approach
Collected financial data, engineered metrics (ROE, current ratio, debt-to-equity, etc.), validated data quality with Python, then modeled in Power BI with drill-through and filters.
Results
Dashboards support quick comparison across companies, trend analysis over time, and identification of outliers for further investigation.